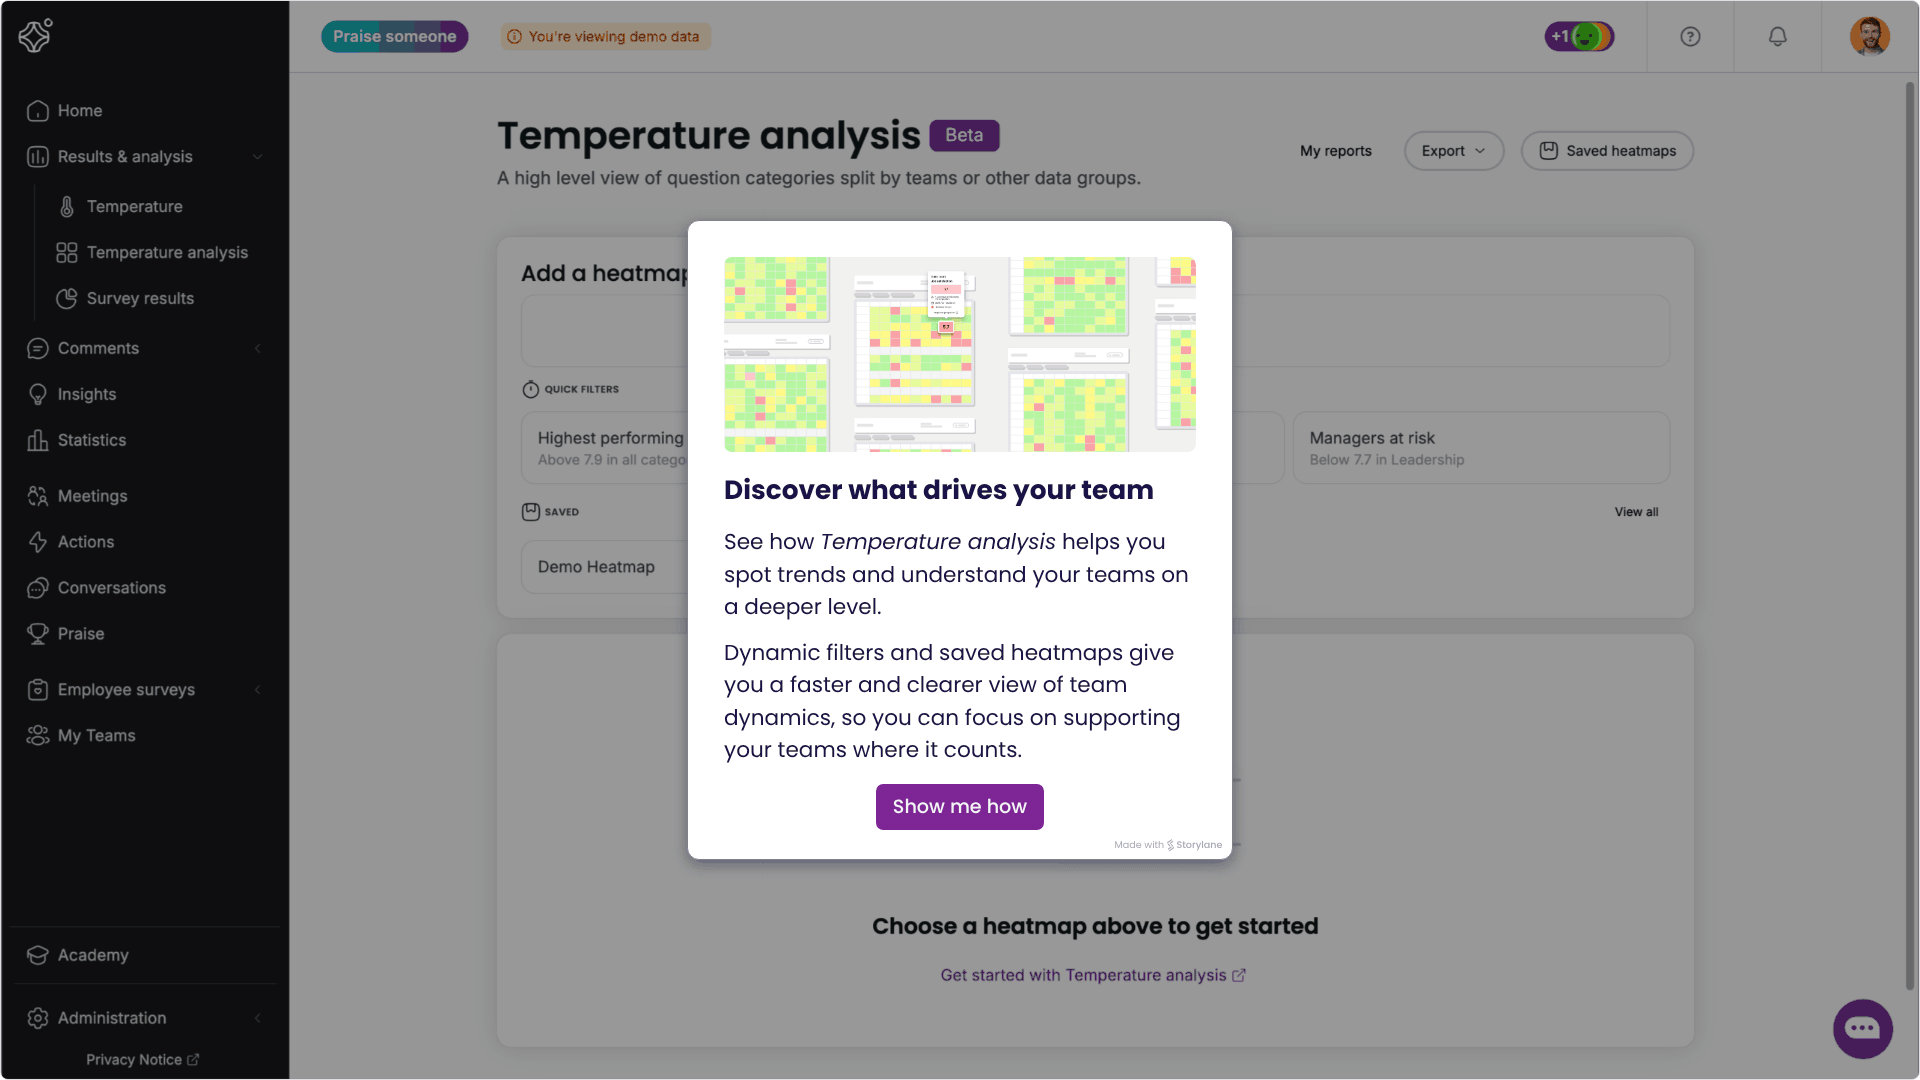
With Temperature analysis, you can explore your team's performance, add heatmaps to compare results, spot trends, and understand what's driving them.
If your organisation runs Periodic surveys, you'll find a tab switcher on the Temperature page to move between Pulse surveys and Periodic surveys.
Key features
- Filtering: Narrow down by temperature, team, or category to find patterns.
- Save & duplicate: Keep your filters and reuse them for future analysis or recurring reporting.
- Quick filters: Predefined quick filters help you get started right away.
- More context: Gain a deeper understanding of results with trend, team type, and organisational structure.
- Flexible sorting: Sort by hierarchy or by each temperature.
-
Cleaner layout: Hide empty rows and columns for a more straightforward overview.
💡 Nested or flat view
The heatmap chart lets you choose how to view your teams:
Nested view: Shows teams in your organisational hierarchy, grouped by parent team.
Flat view: Displays all teams in a single list, including subteams, allowing for easy comparison.
Add a heatmap
- Start by choosing which data you want to explore
- Select All data to explore results from all teams
-
Use a quick filter to jump straight to what matters (The thresholds below are based on a statistical analysis of Winningtemp data.)
- Highest performing teams – above 7.9 in all categories
- Lowest performing teams – below 7.4 in all categories
- Managers at risk – below 7.7 in Leadership
- You can start reviewing the heatmaps right away, or click Filters to narrow down the results.
- Once you’ve found a view you like, click Save to keep it for later.
- To close or duplicate a heatmap, click the three dots.
- Want to add another heatmap? Just repeat the steps; it’s quick and easy.
Saved heatmaps
You can save up to 20 custom heatmaps, making it easy to return to the exact view and filters you need. This saves time whenever you want to recheck the same data.
Click on Saved heatmaps.
Select the heatmap you want to load.
Export your heatmaps
Click "Export" to download all visible heatmaps into a single Excel file.
Each heatmap gets its own sheet, named after the heatmap title.
The selected time period is shown at the top of each sheet.
The file is named with the export date and time.
You'll find your export on the Your reports page as soon as it's ready.